Introduction
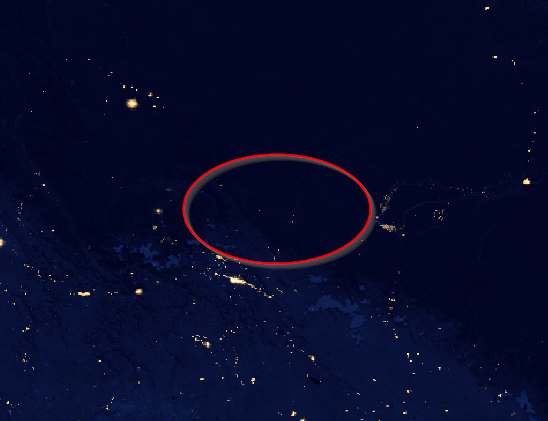
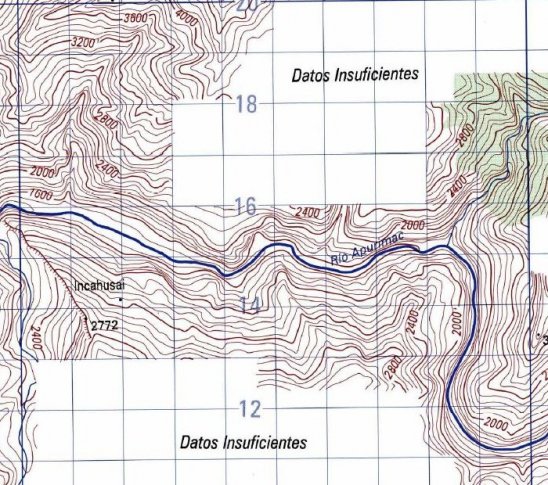
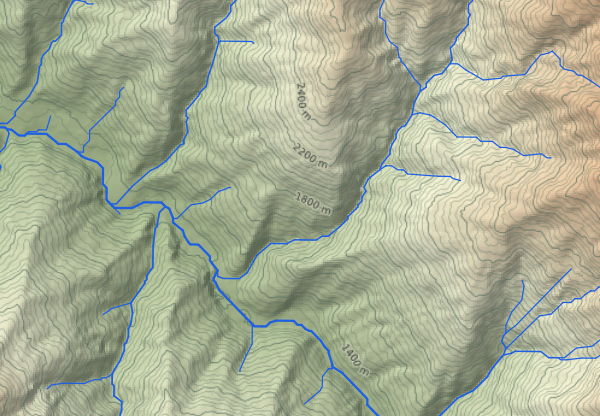
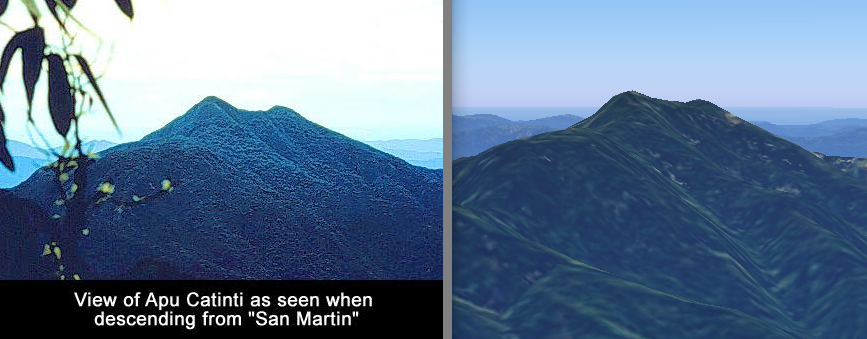
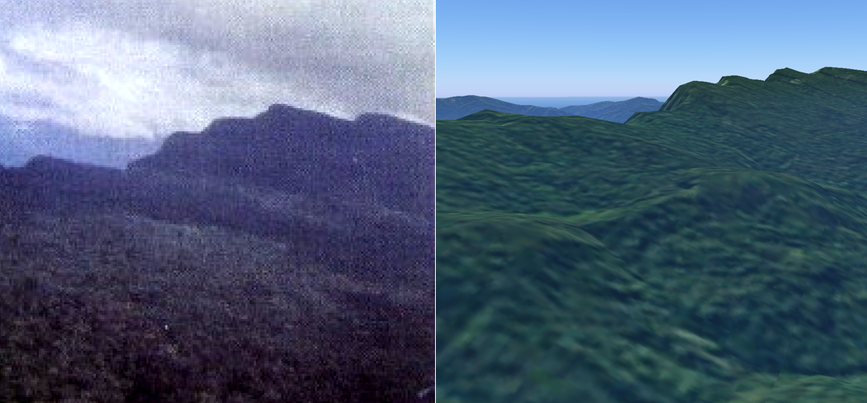
Since the beginning of 2017, we have collected all sorts of spatial data concerning Paititi: satellite images, old and modern maps, written and verbal testimonies, results of other expeditions, true documents and legends. It was a difficult task, which we continue to do to this day. As we work with digital information, we also need maps in digital form: not scanned JPEG images, but in a format suitable for geo-information analysis. The area of our interest is uninhabited region of the Eastern slopes of the Andes, and cartographic materials for it are nowhere to be found. And if they are, then of a small scale and not informative enough. To understand what we are dealing with, take a look at these two illustrations below:
Only remote sensing of the Earth (hereinafter—ERS) gives us the opportunity to obtain reliable and relevant information about the study area, and geographic information systems (hereinafter—GIS) bring together knowledge about the territory in one place, and help us in the search for an answer to the main question: “Where is Paititi?”
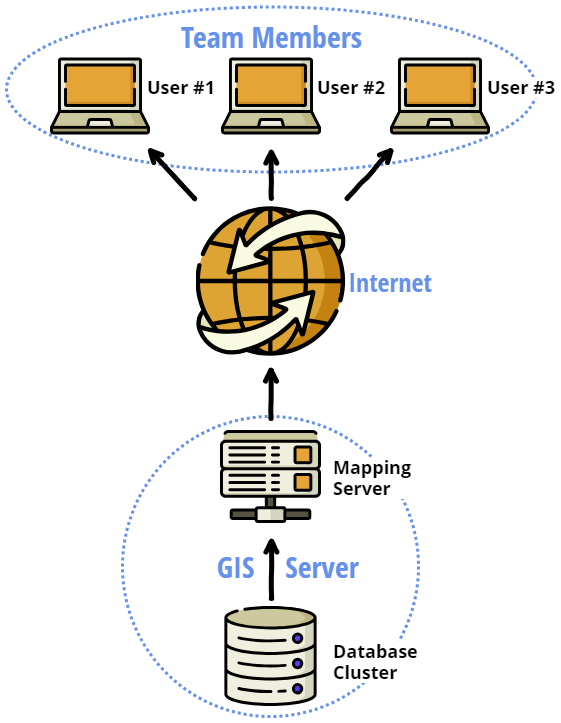
Structure of “In Quest of Paititi” GIS
To benefit from the collected data, we have developed our own GIS—let’s call it for the sake of beauty “In quest of Paititi”. At the heart of its infrastructure is a virtual private server working under the Ubuntu operating system. On the server (we call it a GIS server) we installed some open-source geo-information and mapping software:
- PostgreSQL—an object-relational database management system with PostGIS extension to support geographic features
- GeoServer—software for publishing geodata on a server (map server)
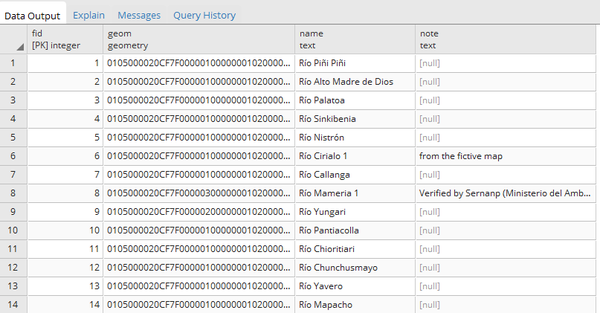
Geographical objects belonging to different types (for example, “rivers”, “Inca roads”, “villages”, etc.) are stored in separate tables, and their coordinates are recorded in an unreadable binary form (for processing speed):
Once a week, the database is automatically backed up and sent to the cloud storage to prevent the loss of our hard work in case of a GIS server failure. Within one day, we can restore the project to at least a week-ago state.
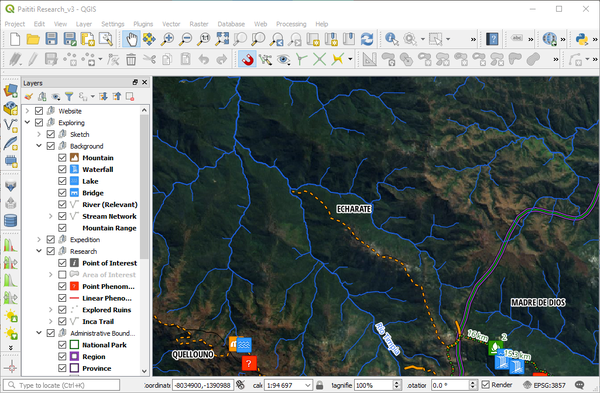
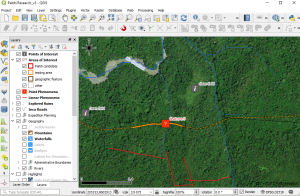
Storing all of our spatial information in one database gives us a great opportunity—all members of the Paititi Research team can remotely connect to it from anywhere in the world. To do this, you need to install the open source software QGIS (it works under Windows, Mac OS and Linux) on your computer. In QGIS you can already view our geodata in the usual form of a map consisting of individual GIS layers, as well as to conduct a variety of analysis. The access level is set up for each user individually, determining what can be seen or edited (for example, add new objects by interpreting satellite images).
Geo-information Analysis
Then begins the most interesting step—geoinformation analysis: the creation of new knowledge from existing one. That’s where we start to prove ourselves in full. Here it is important to note the great contribution that the digital elevation model (hereinafter—DEM) makes for our research. It allows to extract the quantitative characteristics of the surface and simulate the movement of water flows, as well as calculate the illumination of the territory.
Modelling of the Detailed Drainage Network
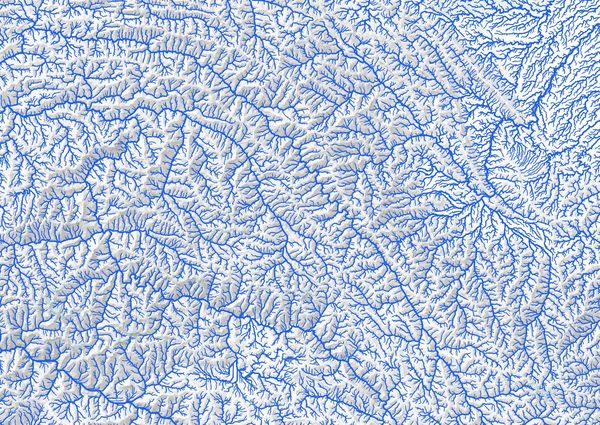
The river network is the basis of our research, with which we began our work. The names of the rivers refer to literary sources; all expeditions describe their movements relatively to rivers; with the help of rivers we georeference old maps; finally, along the rivers people built and build their homes. In order to refer odd verbal information with coordinate reference in GIS, it is crucial to have a detailed map of the river network with the actual names of streams. And you will not find such a ready map. Fortunately, simulationg of the movement of water flows, having a DEM, is not a big problem. Which we did. Of course, after receiving such a map, it is necessary to provide rivers and streams with names, which is already a much more difficult task: being in the other hemisphere of the Earth, it is not always possible to find out how the locals call some small river (alas, the Internet is not omnipotent). However, in the end we were able to identify all the rivers, which are somehow connected with the search for Paititi.
Obtaining Morphometric Characteristics of Relief
Relief specifies how rivers flow, how surface is wet and illuminated, and how trees grow. For those who have worked with topographic maps and DEM, it should be obvious: the relief is the basis of how we settle and conduct our economic activities.
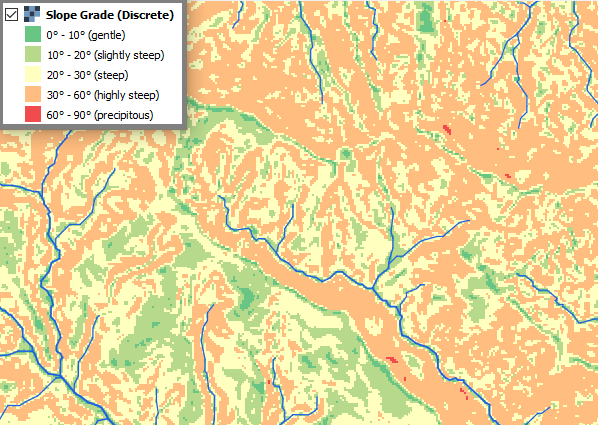
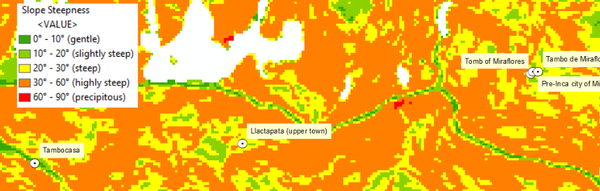
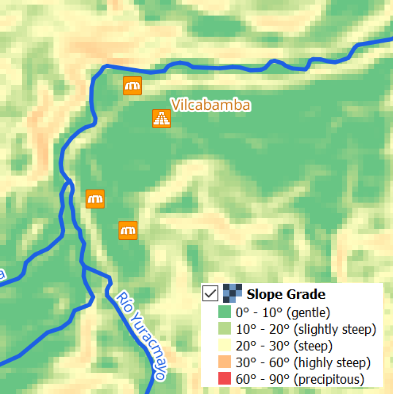
Surface Steepness
The steepness (or slope) determines the grade of surface change in the horizontal and vertical directions and is measured in degrees from 0 to 90. We tried to see what values of slope correspond to ancient and modern settlements in the area of our interest. The results are interesting: it turns out that the settlements are located on surfaces with a steepness of no more than 20°. Even living in the highlands, people still find quite flat surfaces for life. Thus, we can significantly reduce the search area, confidently eliminating uninhabitable areas with a steepness of more than 60°.
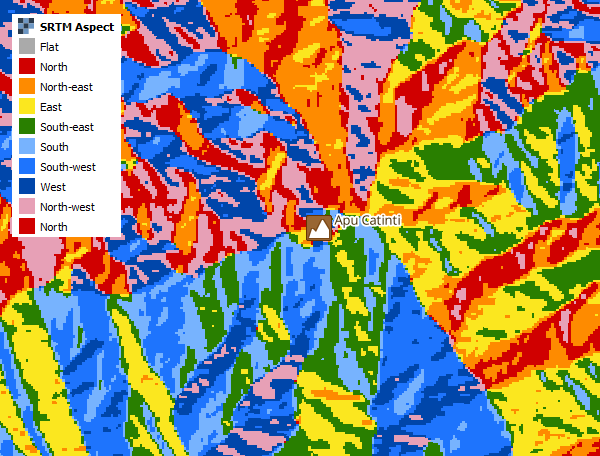
Surface Aspect
Every known Inca site in the center of their empire was situated to receive the morning sun (both for religious and practical reasons) [1]. The question arises—is it possible to identify such areas of the territory in which it would be possible to meet the dawn? The answer is yes—we can do that by calculating the aspect of the relief, which determines the downslope direction with respect to the compass. This is a trivial task in GIS.
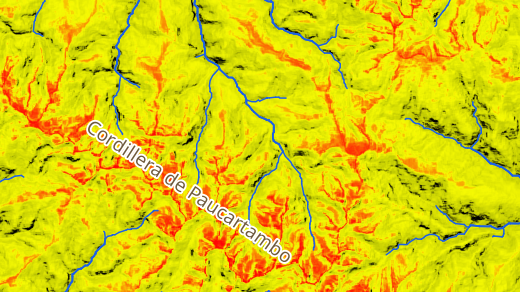
Calculation of Incoming Solar Radiation
Studying the space images and DEM, we noticed that some areas are constantly in the shadows due to the peculiarities of topography. Then another idea came to our mind: what if we evaluate the incoming solar radiation to the surface (insolation) to filter out such places, unfavorable for life? To calculate the insolation we used a software called ArcGIS Pro—it took several days, because the process of calculations is very resource-intensive. The result is a thematic raster map of the radiation distribution, where each pixel contains a number expressed in watts per square meter (W/m2). Of course, absolute values of insolation are not important for us. We compared what radiation levels correspond to modern settlements and discovered ruins, and eventually cut off obviously unfavorable areas that are almost not lit by the sun.
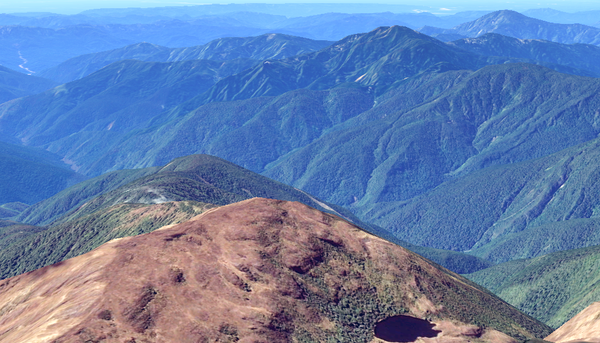
3D Modelling
The addition of the third dimension to spatial data significantly increases our ability to interpret it. Having a DEM you can recreate the terrain in 3D and then overlay all the other data on it.
Visual analysis
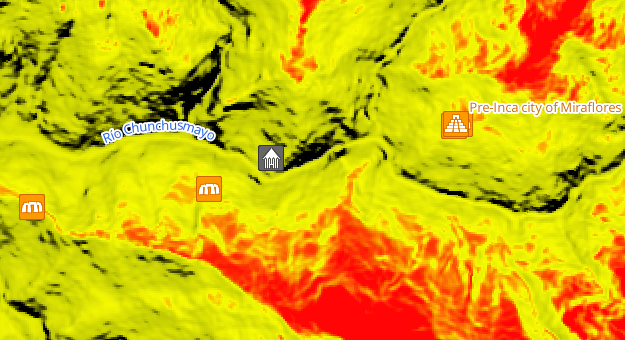
Computer Analysis of Visibility
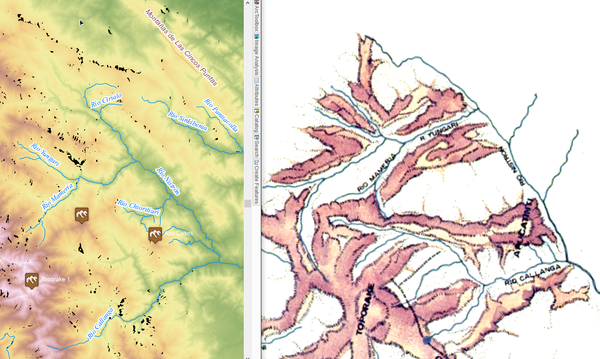
Studying the territory in three-dimensional mode, we suddenly found one interesting fact: all the ruins in the valley of the Chunchusmayo river were mutually visible:
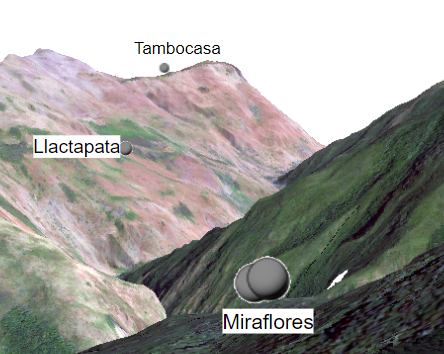
Later we found confirmation of our theory. Incas regularly used simple communication methods in direct line of sight: smoke and reflected sunlight by day and watchfires by night [2]. Thus, armed with another clue to the search for Paititi, we began to test the theory in practice to highlight the areas with ability to be observed from the already known ruins.
Creation of Thematic Maps
The so-called thematic maps convey with great completeness elements, properties or phenomena that are not shown on general geographic maps. We are interested in two properties of the landscape, for which no maps can be found—they are the suitability of the territory for people and its passability (permeability) on foot.
Passability Map
We need this map to plan a ground expedition, to make the route on the most optimal way (in terms of duration and ease of movement). As the main factors affecting the permeability, we have chosen:
- tree density
- surface slope
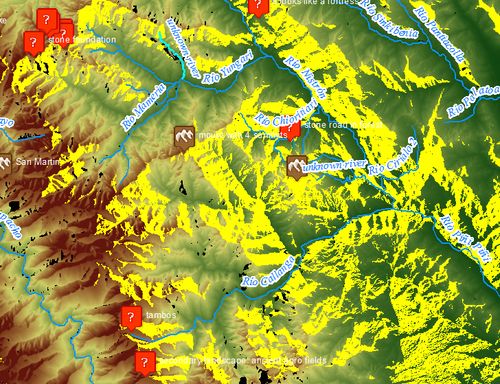
To assess the density of the forest, we used the maps of the VCF (Vegetation Continuous Fields), created at the University of Maryland based on data from Landsat satellites. For the estimation of the slope we took DEM. To combine these two data sets, they were reclassified to the same values. The resulting passability map shows the distribution of the index in a value from 1 to 5, where 5 are easily passable areas (flat and deforested), and 1 are absolutely impassable ones (steep slopes with dense forest).
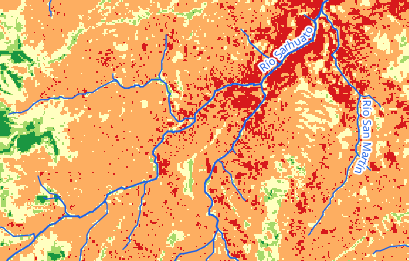
Different color on the map encodes different values of the terrain passability index:
- Red—impassable
- Orange—almost impassable
- Yellow—hardly passable
- Light green—passable
- Dark green—easily passable
Map of Suitability for Settlement
We have created several different maps for individual factors that we believe affect the suitability of the territories to people’s life. These factors are to you already known maps of steepness, insolation and surface aspect. We also tried to assess the moisture content of the study area through the calculation of the so-called topographic wetness index. However, after numerous experiments, we stopped only on two factors, of which we created a map of suitability for settlement:
- slope steepness
- insolation
The principle of combining these two maps was the same as for the terrain passabillity map. As a result, we have an index of suitability, taking values from 1 to 5, where 5 corresponds to flat and well-lit areas suitable for human activities.
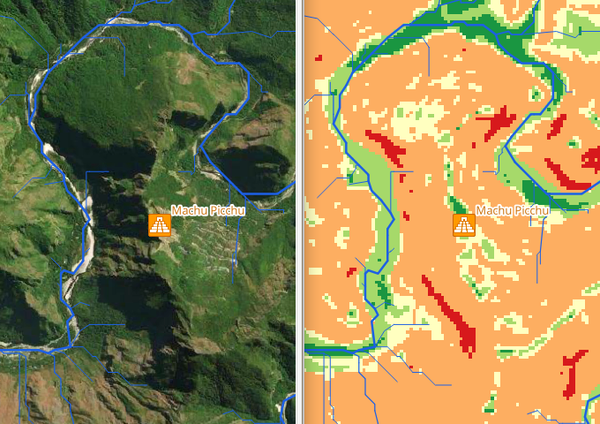
The suitability index is coded on our map in different colors as follows:
- Red—highly unsuitable
- Orange—unsuitable
- Yellow—slightly unsuitable
- Light green—suitable
- Dark green—very suitable
The initial area of our research was approximately 1300 sq. km. After mapping suitability for settlement, we have reduced the research area for several times, sparing us many hours of fruitless work.
Interpretation of Satellite Images
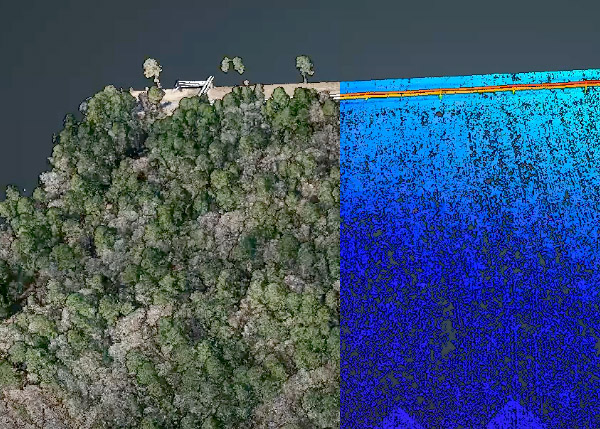
This is the final stage of our office studies. By significantly reducing the search area of Paititi using the above spatial analysis, we were able to go further to the interpretation of remote sensing data from various satellites and aircraft (read more in “Geospatial data we use”). Now we can study in detail the territory of the high Peruvian selva in search of something “suspicious”, using different spectral ranges: from the visible (average wavelength of 500 nm) to the microwave (wavelength of about 20 cm).
We performed the interpretation visually, using the most advanced tool for this: our eyes and brain. In fact, we have experience in automatic feature detection, and we tried to automate this process, but faced several problems:
- We are unable to clearly formalize what are we looking for to computer-understandable form. This can be, for example, a variation in the color and brightness of the forest cover, a kind of play of shadow and light… We have an idea of how to apply machine learning techniques to search for archaeological sites in uninhabited areas, but it requires serious scientific study and a lot of experience in writing new machine learning algorithms.
- Remote sensing data that we have and which is suitable for detailed searches, have insufficient spectral resolution. We tried to link the spectral properties of vegetation with the properties of the underlying surface. For example, if some stone structures are semi-buried under the canopy of the forest, they certainly change the regime of moisture and nutrition of the soil in a particular place. This should affect the chlorophyll content in the leaves (which we can measure from space), the amount of biomass, which ultimately leads to a change in the reflectivity in contrast to the surrounding trees. Unfortunately, the most suitable publicly available space images that can solve this issue have a low spatial resolution (about 10 m). It is necessary to order space imagery from commercial super-high-resolution satellites (30 cm).
You can look at some of the found potential ruins on the “Current outcomes” page.
Outlook
Acquisition of remote sensing data with the best spatial and spectral resolution (and such data are available on the commercial market) will allow us to significantly speed up and simplify the task of finding new archaeological sites. Anyhow only a ground expedition will be able to dot the i. The best option, which we strive for, is the acquisition of an unmanned aerial vehicle (UAV), equipped with a laser scanner (lidar), which will provide a detailed image of the surface under the cover of a dense forest.