Introduction and Basic Concepts
Remote sensing of the Earth (hereinafter ERS) brings up incredible opportunities for modern researchers. Without it we would not be able to search for Inca ruins in the jungle of the Peruvian Andes. To better explain what it is and how we work with it, let’s first define the term “remote sensing”.
Remote sensing is the measurement of object properties on the Earth’s surface using data acquired from aircraft and satellites [1].
There are actually broader definitions, but we will not touch on them, because they do not belong to our topic—for example, echolocation of the seabed using sound waves, or x-ray examination of patients in the hospital. In the case of satellites and aircraft, information about the sensing object is transmitted to the recording sensor by electromagnetic waves (hereinafter EM waves). In the process of ERS we can identify seven main consecutive steps:
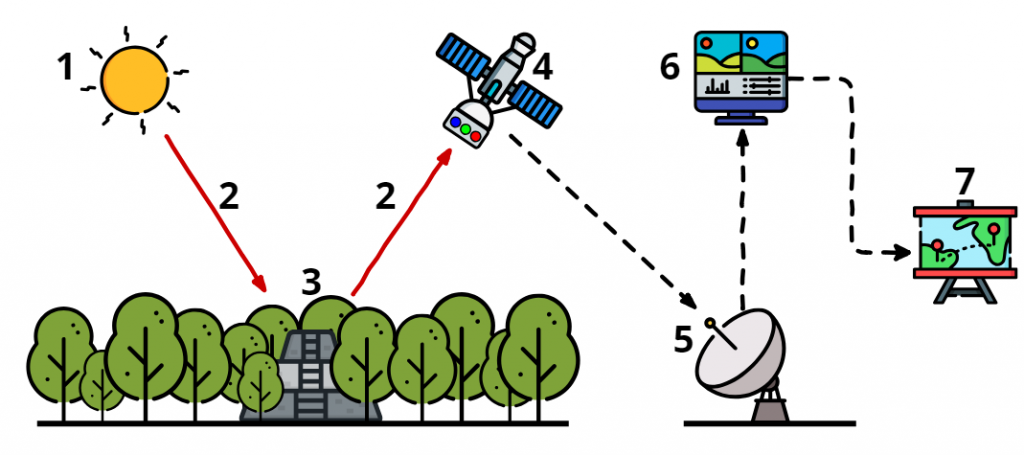
- The source of EM energy (in common cases it is the Sun, but there are other options: the Earth’s own thermal radiation or microwave radiation, which is emitted by the satellite itself)
- EM energy propagates through the atmosphere (as long as the radiation passes through the medium, it gets scaterred, absorbed and undergoes other changes)
- Interaction with the target (absorption or reflection of EM waves)
- Recording of EM energy by the sensor installed on the platform (in this case—on the satellite)
- Transmission of ERS data to the ground receiving station and primary processing of this data
- Interpretation and analysis of data in special software
- Application of the analysis results
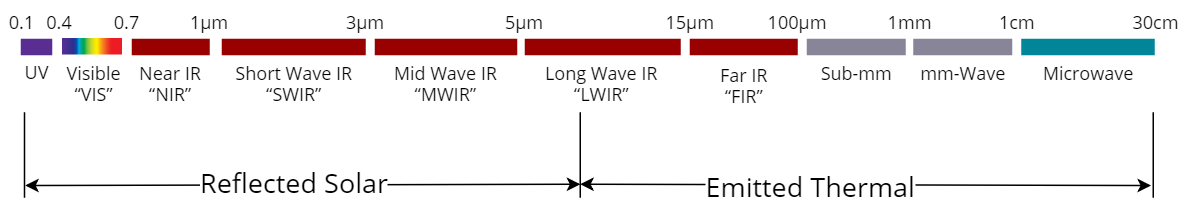
To understand ERS, it is important to note several concepts. First, it is the EM radiation range that the sensor registers. Our eyes are able to perceive only a narrow spectrum of EM radiation, called “visible”, but the sensors used in ERS are able to register radiation from other ranges that are invisible to us. This makes it possible to observe the “unobservable”, as familiar to our eyes objects differently reflect EM waves of various wavelengths, and therefore look unlike.
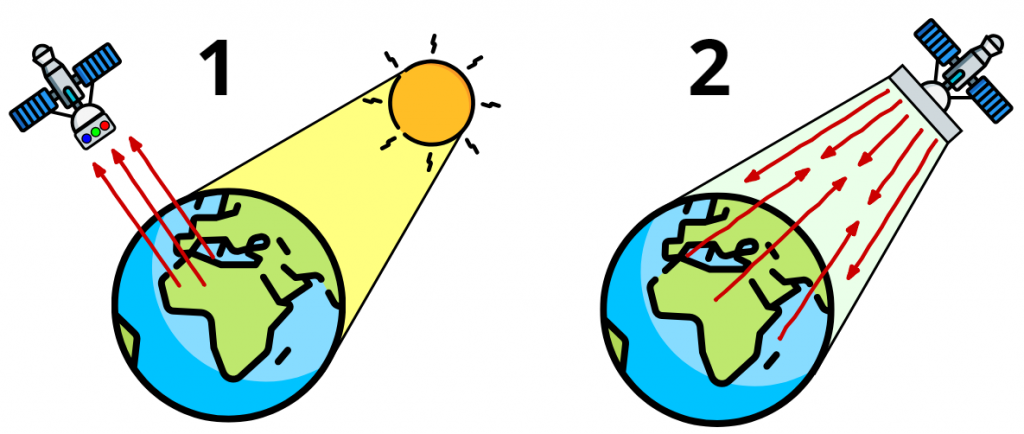
Secondly, all sensors are divided into two types: passive and active. The first ones register natural radiation, whether it is reflected solar radiation (as it is done by a camera in your phone) or emitted thermal radiation of an object. The second ones illuminate targets generating radiation by themselves and register the reflected waves, as for example, in radar imaging or laser scanning.
The Dawn of Open ERS Data
In Paititi Research we primarily use ERS data from satellites available to the general public, free of charge or for a reasonable price. As independent researchers we rate not only the quality of data (for example, high spatial resolution), but also the financial side of data acquisition. So you may wonder, where did these public space images come from? We will not go far into history, although it is interesting to read at least about aerial photography using pigeons during the First world war [2]. Instead, we will try to mention the main milestones:
- The beginning of modern remote sensing (with digital images and not with film, as well as with high spatial resolution in contrast to meteorological satellites) was laid in 1972 when NASA launched the first satellite of their Landsat mission—then it was called ERTS (Earth Resources Technology Satellite) [3] [4]. This is one of the most successful ERS programs—now it is their newest Landsat-8 satellite that is orbiting the globe. The peculiarity of the first Landsat was that this spacecraft was designed primarily for research of the Earth for civilian purposes, which was a significant step considering that it was happening during the cold war.
- The number of satellites grew over time, quality of data became better and variety became bigger. However, ERS still remained the prerogative of a very narrow group of specialists, as most of the satellites was operated by American or Russian military and intelligence organisations [5].
- After the end of the cold war, tensions subsided and satellites became more “civilian”. And so, in 1999 there was a breakthrough with the launching of a commercial satellite IKONOS [6], which imaged Earth with unprecedented spatial resolution of 1 m. Because such fine spatial accuracy allowed to solve new business problems, it has spurred the development of remote sensing.
- In 2001 the first version of Google Earth—a large popularizer of remote sensing—was released [7]. In fact, then Google Earth was called differently, as it had been originally developed by Keyhole, which Google acquired in 2014.
- In 2002, the results of Shuttle Radar Topography Mission (SRTM) were published in open access. SRTM is an international research project on the creation of a global digital terrain model with high resolution [8].
- In 2008 the US Geological Survey (USGS) opened free access to a huge archive of Landsat mission imagery [9]. Scientists and experts from all over the world began to actively use this data.
- In 2014 the first remote sensing satellite of the European space Agency (ESA) was launched under the Sentinel program. Now there are several satellites in orbit, and ERS data from these satellites is available for free [10].
- ESA has been heading for open data and open science for several decades. As a result, in 2017 they formally adopted the policy of open access to ESA information and data to promote the widespread use and development of their space activities [11].
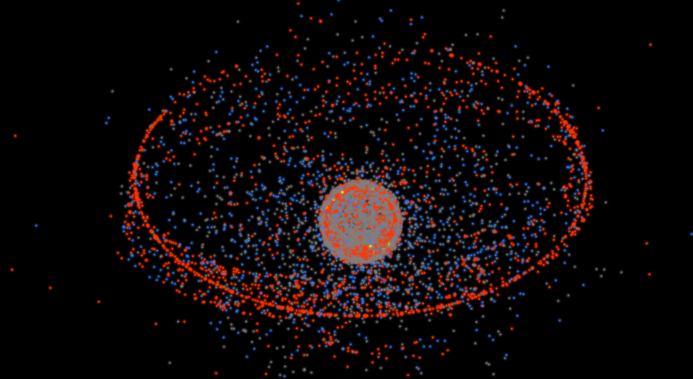
At the moment, we see that there are already commercial companies that create their rockets, satellites and other related products [12], and even allow themselves such nonsense as launching a car into space [13]. So now it is obvious that not only ERS , but also space as a whole was commercialized and entered the masses. To assess the degree of human development of near-earth space, just look at this picture:
Satellite Images Are Not Just Pictures
Many of you already worked with space images in online maps or programs like Google Earth. However, what you can see there is only the tip of the iceberg of ERS data. The point is that images in online maps have reduced spectral, radiometric and often spatial resolution. Space images, or rather ERS data, allow you to measure different characteristics of targets:
- lengths
- areas
- volumes and heights (for example, if you build a digital terrain model from stereo images)
- chemical composition (multispectral images can, for example, identify the type of plant or rock)
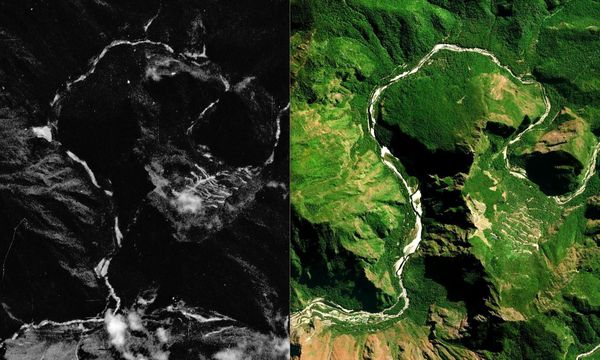
Take a look at images below to understand what this is about:
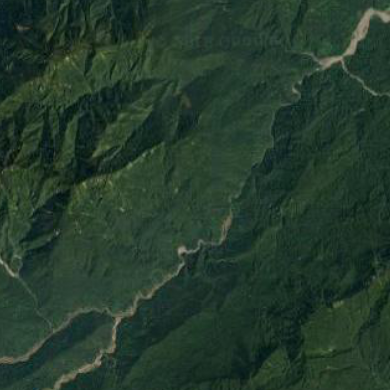
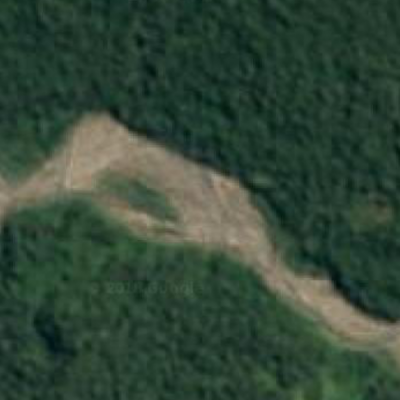
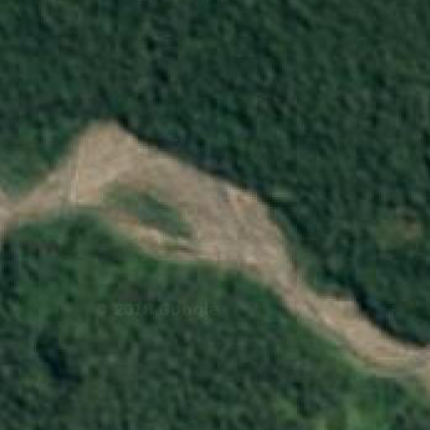
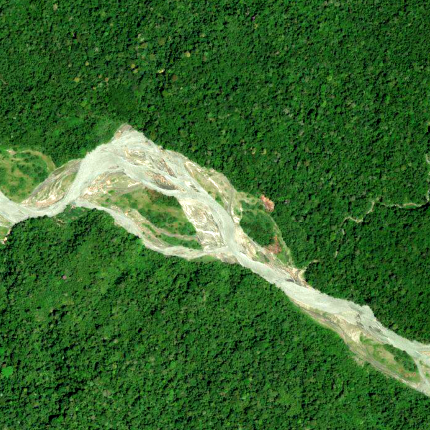
An area in the Manu national Park (Peru):
- Screenshot from Google Earth, showing the area in natural colors. Landsat/Copernicus Data.
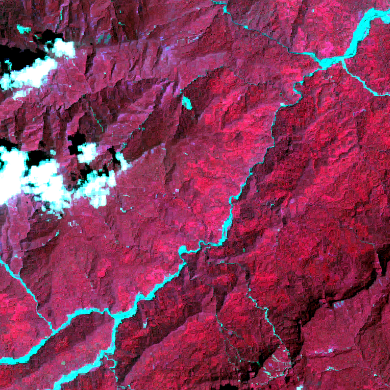
- A pseudo-color image (VIS+NIR) obtained from Sentinel-2 satellite data. Copernicus Sentinel data 2016.
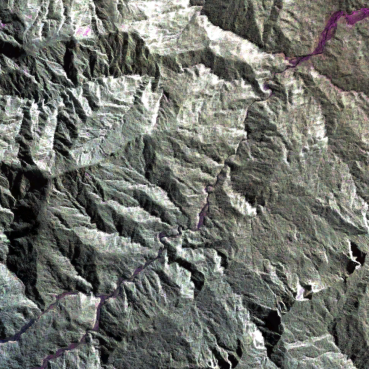
- A pseudocolor image from different L-band polarizations obtained by a synthetic aperture radar (HH—red, HV—green, VV—blue). Data courtesy of NASA/JPL-Caltech.
- Thermal image. Landsat-8 data courtesy of the USGS.
- Short-wave IR image. Landsat-8 data courtesy of the USGS.

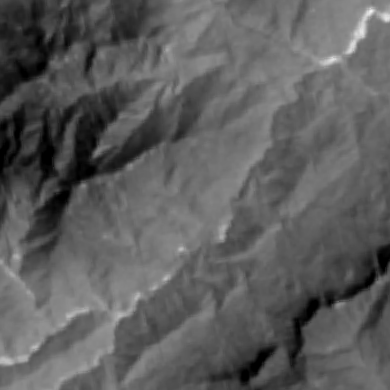
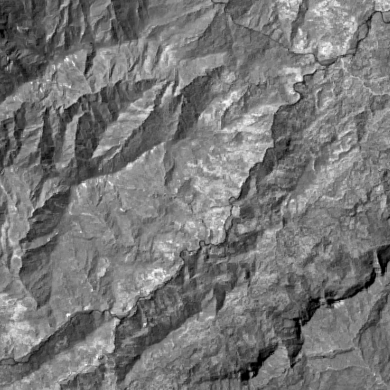
An area in the Manu national Park (Peru) on a large scale:
- Screenshot from Google Earth, where low spatial resolution of the data is obvious. Landsat/Copernicus.
- Image from WorldView-2 satellite, DigitalGlobe data.
Application of ERS in Archaeology
With the launch of the first Landsat satellite by the Americans in 1972, a new era of ERS in archaeology began [14, p.1]. To date, remote sensing products from space, available to the general consumer, allow to:
- Save, because it does not require expensive ground surveys or aerial survey (today huge archives of ERS data are collected, and the cost of access to them is relatively low)
- Study hard-to-reach areas (for satellites it is all the same to image an industrial center or remote areas of the Amazon)
- Get imagery for large areas quickly (wide swaths of satellites allow to scan thousands of square kilometers in a short time)
- Acquire images of the Earth regardless of the weather when using satellites equipped with a synthetic-aperture radar (SAR)
- Obtain high resolution images, comparable in detail with aerial photography
- Reveal phenomena, hidden in the landscape, by spectral analysis, 3d modeling and by using ability of microwaves to penetrate under the cover of foliage and soil
Of course, satellite remote sensing is not a panacea. It should be integrated into geographic information systems (hereinafter GIS) in conjunction with other research methods, including air and ground ones. Thus, when searching for archaeological objects hidden under dense forest cover, lidar (a laser scanner), which is an active tool of remote sensing working in the visible and NIR bands and installed on a plane or drone, proved to be particularly effective. SAR satellites, which are also active remote sensing instruments, can use microwaves to probe the underlying surface in a dense tropical forest [17]. With the help of lidar, archaeologists have discovered the legendary “White city” (La Ciudad Blanca) in the tropical forest in the South-East of Honduras [15]. Recently, tens of thousands of Mayan buildings were discovered in the jungles of Guatemala—this is also the result of the use of this device [16]. The disadvantages of laser scanning are the high cost of its application, small coverage area and dependence on weather conditions. It is only suitable for surveys of a detailed scale, when the research area is narrowed as much as possible.
The book “Remote Sensing in Archaeology” (Wiseman; El-Baz, 2007) describes well the complex application of various ERS data and GIS in the study of the Peten basin of Guatemala, a region of the Maya civilization, most parts of which is covered by dense forests [14, p.137-160 and p.263-282]. Read the article “Testing Our Possibilities” where you can learn out exactly how we use ERS to find Paititi.
Sources of Open ERS Data
Our project largely depends on public ERS imagery, and we are apologists for the openness of science, data and tools for data processing. Below is a list of the main free data sources and tools we use:
Free ERS Data Portals
- EarthExplorer—the US Geological Survey portal, where you can access a large set of ERS data covering the whole world, including Landsat images, digital terrain models, radar images, declassified images of the US intelligence mission CORONA and others.
- Copernicus Open Access Hub—the European Space Agency (ESA) portal, which provides full, free and open access to ERS products from Sentinel-1 SAR satellites, Sentinel-2 multispectral optical satellites and Sentinel-3 ocean/land global monitoring satellites.
- UAVSAR Data Search—portal of NASA Jet Propulsion Laboratory, where you can get imagery of L, P and Ka-bands (microwaves), taken from an unmanned aerial vehicle equipped with a synthetic aperture radar.
Free ERS Software
- QGIS is a free cross-platform geographic information system, which also contains tools for processing, analysis and visualization of ERS data. Developed by the international community.
- Sentinenel Toolboxes are open source toolsets for scientific use of the results of Earth observation missions. Developed by the European space Agency (ESA).
- Orfeo ToolBox is a library for remote sensing image processing, developed by the National Centre for Space Research of France (CNES).
- Google Earth is a satellite map of the entire Earth’s surface in the optical range of EM spectrum, especially effective when viewed in 3d mode.
- ArcGIS Earth is an analogue of Google Earth from the ESRI company.
References
- SCHOWENGERDT, Robert A. Remote Sensing: Models and Methods for Image Processing. 3rd Edition, 2006. ISBN: 978-0123694072, p.2
- Pigeon photography, Wikipedia, last modified 24.12.2017. Retrieved from https://en.wikipedia.org/wiki/Pigeon_photography
- QUITNEY, Jeff. First Landsat: “Earth Resources Technology Satellite” (ERTS) 1973 NASA. YouTube, 2016. Retrieved from https://youtu.be/XiNs7ij8RHk
- Landsat Missions: Imaging the Earth Since 1972. U.S. Geological Survey, last modified 25.04.2018. Retrieved from https://landsat.usgs.gov/landsat-missions-timeline
- Air Force Space & Missile Museum Foundation. The Corona Story – A Point In Time. YouTube, 2016. Retrieved from URL https://youtu.be/k3bzHk_6yHM
- IKONOS Satellite Imagery: First Commercial Space-based Imaging. GISGeography.com, last modified 21.04.2018. Retrieved from https://gisgeography.com/ikonos-satellite/
- WALKER, Tim. How google earth changed the world. The Independent, 05.09.2012. Retrieved from
https://www.independent.co.uk/life-style/gadgets-and-tech/features/how-google-earth-changed-the-world-8107056.html - U.S. topography data from shuttle mission unveiled. NASA NEWS RELEASE, 23.01.2002. Retrieved from https://spaceflightnow.com/news/n0201/23srtm/
- Opening the Landsat Archive/Product Specifications. U.S. Geological Survey, 21.04.2008. Retrieved from https://landsat.usgs.gov/opening-landsat-archiveproduct-specifications
- SENTINEL Program Overview. ESA. Retrieved from https://sentinel.esa.int/web/sentinel/missions
- TROVATELLO, Marco. Open access at the european space agency. ESA, 15.02.2017. Retrieved from http://open.esa.int/open-access-at-esa/
- List of private spaceflight companies, Wikipedia, last modified 11.05.2018. Retrieved from https://en.wikipedia.org/wiki/List_of_private_spaceflight_companies
- AMOS, Jonathan. Elon Musk’s Falcon Heavy rocket launches successfully. BBC, 07.02.2018. Retrieved from http://www.bbc.com/news/science-environment-42969020
- WISEMAN, James R.; EL-BAZ, Farouk (Eds). Remote Sensing in Archaeology, 2007. ISBN 978-0-387-44455-0
- PRESTON, Douglas. Exclusive: Lost City Discovered in the Honduran Rain Forest. National Geographic, 02.03.2015. Retrieved from https://news.nationalgeographic.com/2015/03/150302-honduras-lost-city-monkey-god-maya-ancient-archaeology/
- Sprawling Maya network discovered under Guatemala jungle. BBC, 02.02.2018. Retrieved from https://www.bbc.com/news/world-latin-america-42916261
- Penetrating Tree Cover to See the Forest Floor. NASA Earth Observatory, 25.04.2013. Retrieved from
https://earthobservatory.nasa.gov/IOTD/view.php?id=80982